Dashboard
Upon successful login, the initial screen displayed is the Dashboard. The content available on the Dashboard depends on the access level assigned to the logged-in user.
For Organization / Site / Team Managers the Dashboard includes tools for managing and configuring the system settings. In addition the Dashboard provides an overview of stat-watch usage metrics for the selected organization, offering insights into performance and activity levels within the system.
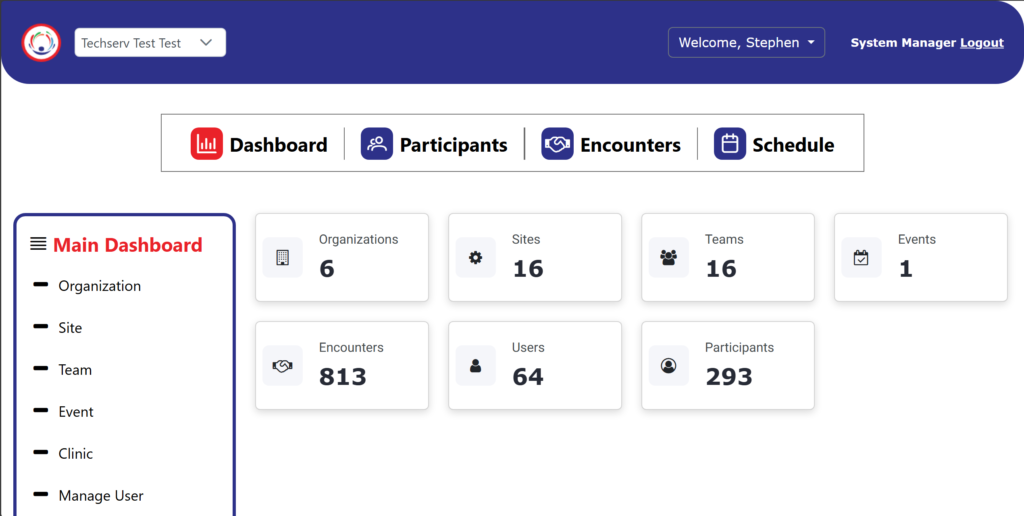
Dashboard on laptop
The far-left Menu, labeled “Main Dashboard,” provides access to Managers to configure their organization. This includes:
- Sites
- Teams
- Events
- Users
- Importing Participants
- Reports
- Surveys
If a standard user is logged in, this menu will appear blank.
At the top of the screen, a Navigation Bar lists the four main sections of the system: Dashboard, Participants, Encounters, and Schedule. This navigation bar remains persistent throughout the application.
The main body of the screen provides an overview of Stat-Watch usage metrics for the selected organization. These metrics include counts of all Sites, Teams, Events, Encounters, Users, and Participants within the system.
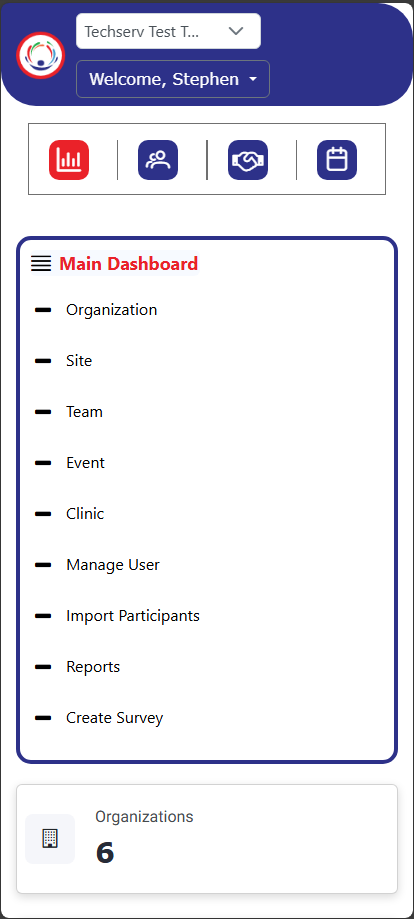
Dashboard on Mobile
The Menu, labeled “Main Dashboard,” provides access to Managers to configure their organization. This includes:
- Sites
- Teams
- Events
- Users
- Importing Participants
- Reports
- Surveys
If a Standard User is logged in, this menu will appear blank.
At the top of the screen, a Navigation Bar lists the four main sections of the system: Dashboard, Participants, Encounters, and Schedule. This navigation bar remains persistent throughout the application.
Main Dashboard and Navigation Bar
Metrics
Scrolling past the Main Menu provides an overview of Stat-Watch usage metrics for the selected organization. These metrics include counts of all Sites, Teams, Events, Encounters, Users, and Participants within the system
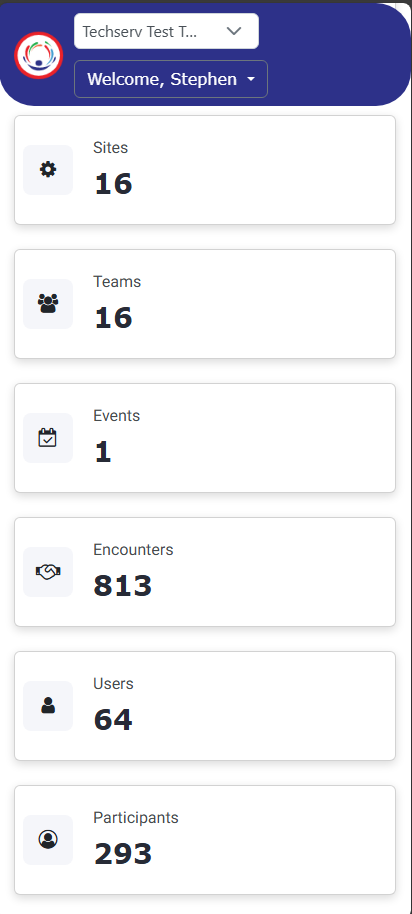
.
Dashboard on Mobile
The Menu, labeled “Main Dashboard,” provides access to Managers to configure their organization. This includes:
- Sites
- Teams
- Events
- Users
- Importing Participants
- Reports
- Surveys
If a Standard User is logged in, this menu will appear blank.
At the top of the screen, a Navigation Bar lists the four main sections of the system: Dashboard, Participants, Encounters, and Schedule. This navigation bar remains persistent throughout the application.
Main Dashboard and Navigation Bar
Metrics
Scrolling past the Main Menu provides an overview of Stat-Watch usage metrics for the selected organization. These metrics include counts of all Sites, Teams, Events, Encounters, Users, and Participants within the system
.
Dashboard on laptop
The far-left Menu, labeled “Main Dashboard,” provides access to Managers to configure their organization. This includes:
- Sites
- Teams
- Events
- Users
- Importing Participants
- Reports
- Surveys
If a standard user is logged in, this menu will appear blank.
At the top of the screen, a Navigation Bar lists the four main sections of the system: Dashboard, Participants, Encounters, and Schedule. This navigation bar remains persistent throughout the application.
The main body of the screen provides an overview of Stat-Watch usage metrics for the selected organization. These metrics include counts of all Sites, Teams, Events, Encounters, Users, and Participants within the system.